Fikri Muhammad Fajri
I'm
Portfolio
Here are some of my recent projects and work highlights.

Tiger Air Booking Flight Analysist
Task :
Data cleaning, exploratory, analysis, and create recommendations
Tools :
Python Tableau Spreadsheet
Project : Description
Tiger Air wants to determine the reasons why many customers do not complete their bookings and analyze the correlation between booking completion and all the features offered by Tiger Air.
Result :
all features show a correlation with the booking complete variable, especially the length of stay feature after feature importance is carried out based on the results of random forest
Customer Segmentation
Task :
Data cleaning, exploratory, analysis, customer segmentation(K-means Clustering) and create recommendations
Tools :
Python(Google Colab)
Project Description :
RevoBank aims to boost credit card engagement by analyzing three years of sales data and developing customer personas. Insights will help the PM team enhance marketing strategies and drive product adoption
Result :
RevoBank can boost customer engagement and credit card usage through data-driven segmentation, identifying higher profitability among female customers and lower usage among Gen-Z. By classifying customers into four clusters—occasional big spenders, frequent small shoppers, high-value customers, and one-time buyers—the bank can optimize direct promotions, implement financial education, integrate with e-commerce, and offer loyalty programs and volume-based discounts to enhance retention and profitability

Dashboard WishFull Bazaar
Task :
Make interactive dashboard
Tools :
Tableau
Project Description :
WishfulBazaar, a leading e-commerce company, aims to enhance data-driven insights to support business growth. This project focuses on developing a sales performance analysis dashboard that presents key metrics such as revenue, sales growth, customer segmentation, regional performance, and customer retention. The dashboard will help management understand business trends, identify sales growth opportunities, and make strategic decisions based on data. Analysis will be conducted using visualization tools like Tableau or Power BI, with a focus on providing comprehensive and insightful data representation.
Result :
RevoBank can enhance sales efficiency and profitability by optimizing payment methods (encouraging PayPal usage and improving transaction reliability), boosting low-performing product categories (books & toys through marketing strategies and bundling), and targeting high-value age groups (20-25 years for electronics & fashion, 65-70 years for home appliances), while restoring profit growth through cost reduction, focusing on high-margin products, and diversifying revenue with premium services

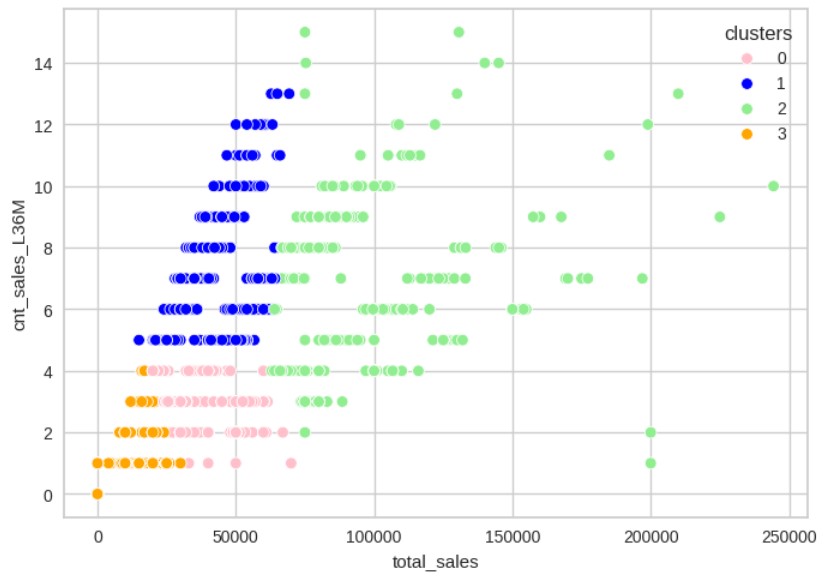
E-COMMERCE CUSTOMER SEGMENTATION ANALYSIS
Task :
Make Customer Segmentation Analysis
Tools :
Google Collab
Project Description :
This project focuses on segmenting customers based on total spending to identify high-value segments and optimize marketing strategies for the next three months. It aims to uncover each segment’s characteristics using key metrics such as average spending, total transactions, and transaction timestamps. The insights will support targeted marketing and improved customer retention.
Result :
The customer segmentation analysis resulted in four distinct clusters based on total spending and transaction patterns.Cluster 1 and Cluster 2 (High Spenders) should be the primary focus for long-term retention through exclusive programs and personalized engagement.Cluster 0 (Frequent Medium Spenders) presents an opportunity for growth through upselling strategies and loyalty rewards.
Cluster 3 (Dormant High Spenders) represents a valuable segment that can be re-engaged with attractive promotional offers.This segmentation provides a solid foundation for developing more targeted and effective marketing strategies tailored to each customer group. Let me know if you'd like a shorter version for slide use.

MANAGING RISK IN REVOFIN’S LOAN PORTFOLIO
Task :
Make comprehensive analytical report deck using SQL
Tools :
Google Big Query
Project Description :
This project helps RevoFin evaluate the quality of its loan portfolio and identify high-risk loan segments to enhance risk mitigation strategies within three months. The objectives include measuring portfolio scale and health, identifying collectibility risks, and detecting performance anomalies across borrower cohorts. Key metrics used are Outstanding Amount (OS), Ending Net Receivables (ENR), and TKB30.
Result :
The customer segmentation analysis resulted in four distinct clusters based on tThe analysis of RevoFin’s loan portfolio reveals that overall loan performance is strong, with the majority of loans classified as “Current” and TKB30 consistently near 100%, indicating excellent repayment behavior. Outstanding Amount (OS) and Ending Net Receivables (ENR) have steadily increased since 2015, suggesting healthy and sustained portfolio growth. However, the cohort analysis identified a group of anomalous borrowers who exhibit slightly lower home ownership and annual income, which may reflect a higher financial risk profile. Interestingly, these higher-risk borrowers are receiving lower average interest rates, which could indicate a misalignment in risk-based pricing strategies. Meanwhile, employment length shows no significant difference between anomaly and other cohorts, suggesting it does not contribute meaningfully to risk differentiation.

HR and Medical Specialist Data Insights
Task :
Make Dashboard for Monitoring HR and Medical Spesialist in Hasna Medika Group
Tools :
Spreadsheet, Power BI
Project Description :
THasna Medika Group needs an HR analytics system to monitor staff and specialist performance in real-time, identify turnover trends, and support data-driven decisions. The project also aims to link specialist performance with business outcomes.
Key metrics include total employees, turnover rate, total patients, and specialist revenue, using data from 13 branches analyzed monthly at individual and branch levels.
Result :
The analysis shows that Hasna Medika Group has 13,000 employees, with 82.5% being female, primarily due to the high number of nursing and support staff. Overall retention is strong, but notable spikes in employee turnover occurred in May 2024 and November 2023, especially at the HM Cibubur and HM Cakung branches. These resignations were mostly from non-specialist and managerial health staff, suggesting potential issues such as workload imbalance or limited incentives.
HM Cibubur recorded the highest turnover in the last quarter, indicating a need for closer investigation. On the other hand, productivity data from the top 10 specialists revealed a strong correlation between the number of medical procedures and revenue, highlighting opportunities to implement performance-based incentives and improve patient distribution among doctors

Medical Service Monitoring Insight
Task :
Make Dashboard for Monitoring HR and Medical Spesialist in Hasna Medika Group
Tools :
Spreadsheet, Power BI
Project Description :
Hasna Medika Group requires a comprehensive analytics system to monitor pharmacy costs (HPP) and service volumes in real time across various clinical units. The project aims to identify cost differences between chronic and non-chronic care in a structured manner, enabling hospital management to make data-driven decisions for cost control and operational efficiency. In addition, this initiative seeks to connect data on medication usage, doctors, and medical services with financing strategies (especially BPJS) to ensure accurate and sustainable healthcare funding.
Result :
The analysis reveals that 97% of medical transactions come from BPJS patients, making them the primary driver of pharmacy costs. Interestingly, monthly HPP trends do not always align with the number of items sold, as costs are often influenced by the type of drugs prescribed. Chronic medications contribute significantly to overall pharmacy expenses, while BPJS prescriptions tend to be dominated by non-chronic drugs each month. Furthermore, three doctors—ATK, AWK, and SPK—account for more than 50% of BPJS prescriptions. The Heart Clinic shows the highest BPJS transaction volume for both chronic and non-chronic drugs, indicating a balanced approach in treating both long-term and acute conditions.

Project Based Rakamin X Kimia Farma
Task :
Make Dashboard for Monitoring Business Performance of Kimia Farma (2020–2023)
Tools:
Google BigQuery, Looker Studio
Project Description:
Kimia Farma requires a performance analytics system to track revenue, profit, customer satisfaction, and transaction trends across its national branch network. The project aims to uncover key drivers of revenue fluctuation and identify strategic priorities for improving profitability. Through structured dashboards, this initiative helps management visualize performance gaps and develop targeted operational strategies across branches and provinces. The dashboards also provide insights into customer experience, service satisfaction, and the financial impact of discounts and sales across time.
Result :
The analysis reveals that Java Barat contributes the most to both revenue and profit, with its top three branches leading national performance. Despite having the highest transaction volume, some provinces show lower net profit due to discount practices or low customer satisfaction. Interestingly, branch ratings are generally higher than transaction ratings, suggesting issues in digital services or pricing rather than in physical service delivery.
Profit margins averaged around 28.5% of total revenue across the years, with the peak revenue observed in 2022, likely due to the COVID-19 pandemic. Branches in Makassar, Bandung, Samarinda, Balikpapan, and Kupang received perfect satisfaction ratings, indicating best practices that can be replicated across other locations.
Resume
I am a data-driven and detail-oriented Informatics graduate from Telkom University with hands-on experience in analytics across healthcare, finance, and e-commerce domains. My strong foundation in data analysis, gained from both academic and real-world projects, enables me to deliver impactful insights and recommendations.During my recent roles as a Data Analyst Associate at RevoU in collaboration with Hasna Medika and RevoFin, I developed and presented interactive dashboards, performed cohort and clustering analysis, and provided strategic insights for HR, medical services, and risk evaluation. These roles honed my skills in SQL, Python, and Power BI, as well as sharpened my ability to connect data insights with business objectives.With a combination of technical skills, strong analytical thinking, and a collaborative mindset, I am ready to contribute to data-driven decision-making, operational efficiency, and business growth.
Summary
Fikri Muhammd Fajri
Data Analyst Enthusiast
- Jakarta Selatan, Indonesia
- 0823 1165 2576
- fikrifajri08@gmail.com
Education
Telkom University -Informatika (S1)
2019 – 2024
Bandung, Indonesia
GPA: 3.41/4.00
RevoU -Full Stack Data Analytics
Sep 2024 – Jan 2025
Score : 93.65/100
I gained a solid foundation in data analysis, learning key skills in data cleaning, SQL, Python, and visualization, which enabled me to extract meaningful insights and make data-driven decisions. .
Organization
UKM Paskibra Telkom University
Feb 2021 – Feb 2022
Treasurer
- Prepared and managed the budget for all UKM activities, overseeing a budget during my tenure, and utilizing effective Budget Planning to ensure financial stability.
- Maintained thorough, clear, and precise documentation of every income and expense, ensuring that all records align with total transactions via Accurate Financial Recording methods for transparency.
- Allocated funds strategically to ensure the sustainability and efficiency of organizational activities, funding activities or projects, and applying Strategic Fund Allocation techniques.
UKM Paskibra Telkom University
Jan 2020 – Jan 2021
Cadreization Division Staff
- Designed a structured cadre program to build the mental, discipline, and character of new members, developing a program implemented for new members using Structured Training Program methodologies.
- Carried out the cadre program, including regular training sessions, organizational orientation, and field activity simulations, conducting training sessions while providing Mentorship and Guidance throughout the process.
- Taught the core values of the organization, such as discipline, responsibility, teamwork, and leadership spirit, engaging participants in practical exercises and incorporating Practical Leadership Exercises to enhance learning.
Work Experience
Data Analyst Associate-Virtual Internship RevoU x Hasna Medika
Apr 2025 - May 2025
RevoU
- Developed interactive dashboards using Power BI to monitor Human Resources and Medical Specialists across all Hasna Medika branches, which identified a turnover rate of 1.59% with notable spikes in resignations at HM Cibubur and HM Cakung, primarily among non-physician healthcare staff; resulting in actionable recommendations to improve employee retention in at-risk branches, including performance-based incentives and equitable patient allocation among specialists.
- Analyzed Medical Services at Hasna Medika utilizing Power BI dashboards, revealing that 97% of patients used BPJS , with non-chronic prescriptions dominating and chronic medications representing the largest expenses; uncovered that three physicians accounted for over 50% of BPJS prescriptions, while the Cardiology Clinic had the highest transaction volume, leading to recommendations aimed at enhancing cost efficiency of BPJS services, evaluating doctors' prescribing patterns, and bolstering clinical pharmacy support in high-transaction units for improved cost-effectiveness of therapies.
- Recommended strategies focused on enhancing cost efficiency of BPJS services, evaluating physician prescribing patterns, and strengthening clinical pharmacy support in high-transaction units to improve the cost-effectiveness of therapies.
Data Analyst Associate
Mar 2025 - Apr 2025
RevoU
- Created customer segmentation for e-commerce using K-means Clustering with variables total amount, total transaction, and recency, dividing it into 4 clusters for data analysis, thereby enhancing market understanding and enabling more targeted marketing strategies.
- Analyzed portfolio risk for RevoFin using SQL to identify high-risk groups and customer segments, resulting in the majority of loans remaining active, reflecting a healthy portfolio with TKB30 close to 100%; however, cohort analysis revealed anomalous groups with lower income and home ownership, providing better risk considerations in decision-making.
- Presented findings from both projects to the management team to ensure alignment with core strategies, which led to more effective strategy adjustments based on the analysis result.
Transport, Power Planning and Engineering Division Internship
Jul 2022 – Aug 2022
Telkomsel
- Created comprehensive summaries for 4 networking journals such as 5G, Spectrum, Cloud Native and Autonomous Network completed within 1 month, by combining feedback from mentors with additional insights from external resources.
- Presented the summaries back to mentors, receiving positive feedback on presentation skills and clarity of content, utilizing strong communication skills to enhance understanding.
- Extracted key insights from complex content, delivering valuable insights that contributed to future planning discussions by leveraging analytical skills to highlight essential information.
Certificates & Courses